Hypothesis Test
Using a Statistic to test a claim about a Parameter
Steps (Why Can't Cat Play Instruments)
Write the hypothesis
Null hypothesis (H0): Parameter = ____
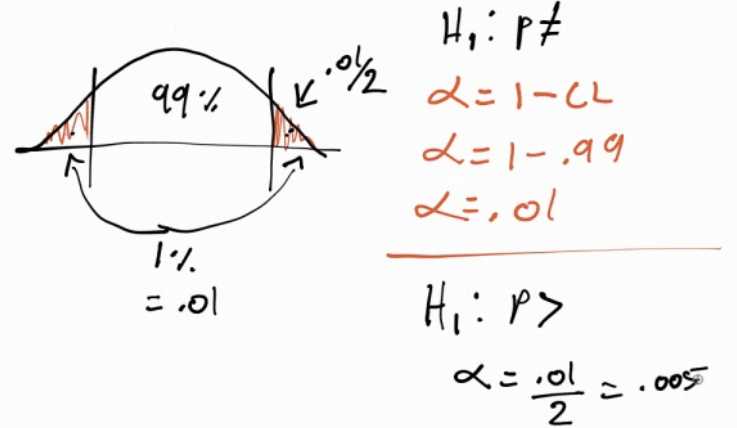
Alternative hypothesis (H1/Ha): Parameter > or < or ≠ ______
Ckeck conditions (RIN)
Random Sample
Independent: N >10n
Normal:
μ: n≥30

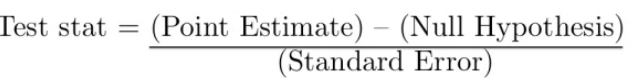
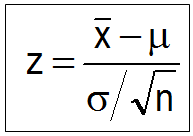
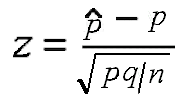
Calculate the test statistic
Mean
Proportion
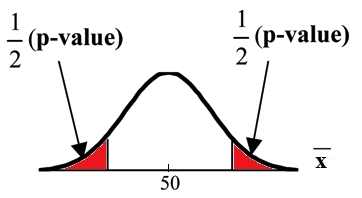
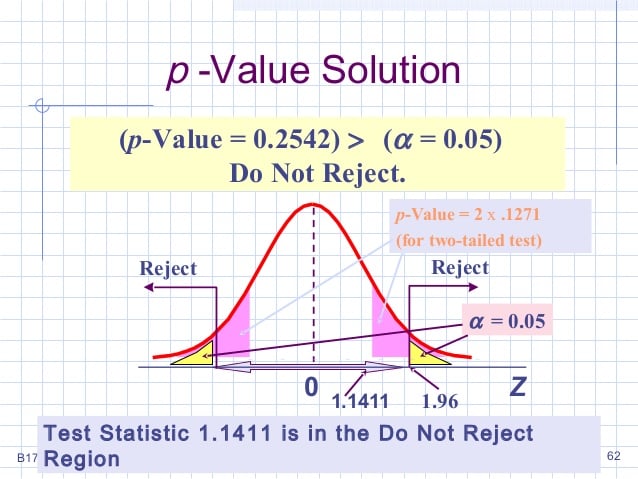
Look up the P-value (from Z table)
- Probability that the null hypothesis (H0) is true, given the sample data you collected
Interpret
| p < α | Reject the null hypothesis | do have evidence to support the claim |
|---|---|---|
| p > α | Fail to reject the null hypothesis | do not have evidence to support the claim |
Confidence Interval vs α
Practice Question 1
DDT is an insectcide. It is believed that DDT causes birds' eggshells to be thinner and weaker than normal and makes the eggs more prone to breakage.
An experiment was conducted where 21 hawks were fed a food mixture 14 ppm DDT. The first egg laid by each bird was measured. The mean shell thickness was found to be 0.17 mm. The standard deviation of birdshell eggs is known to be 0.14 mm. A "normal" eggshell has a mean thickness of 0.2 mm.
Are the eggs with DDT the same as normal eggs?
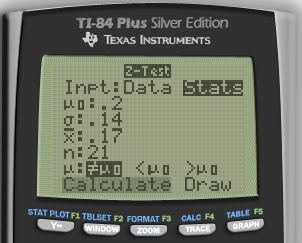
Data
n = 21
Mean = 0.17
Population SD = 0.14
Normal μ= 0.2
Write the hypothesis
Null hypothesis (H0): μ = 0.2
Alternative hypothesis (H1/Ha): μ ≠ 0.2
Check conditions
Random: Assume random sampling
Independent: N > 10n = 210
Normal: sample size is not larger than 30. So, proceed with caution for interpreting results
Calculate the test statistic
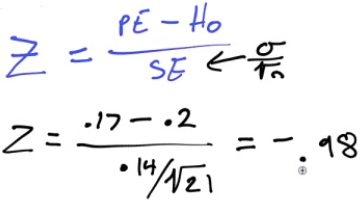
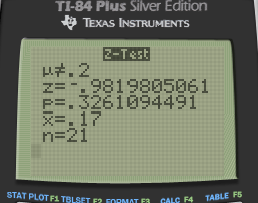
Look up the P-value
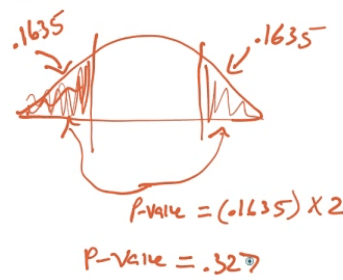
Interpret
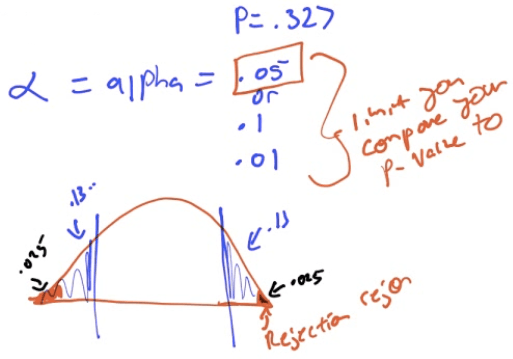
Because our p-value = 0.327 is larger than α = 0.05, we fail to reject H0, which means we do not have evidence to support the alternative/claim that the egg shells are different than normal
Practice Question 2
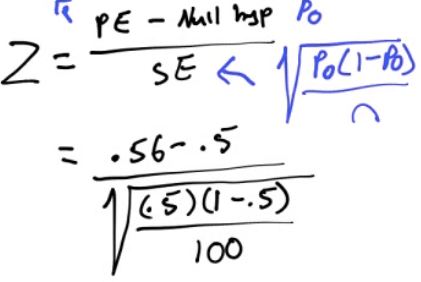
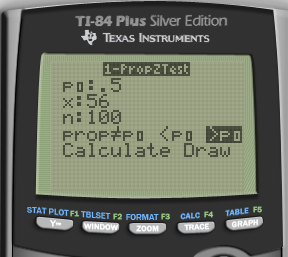
An opinion poll asks a simple random sample of 100 college seniors how they view their job prospects. In all, 56 say "good."
Does the pool give reason to conclude that more than half of all seniors think their job prospects are good.
Hypothesis
H0: p = 0.5
H1: p > 0.5
Conditions
Random: given, SRS
Independent: N > 10n = 1000
Normal:
N*p0 = 100 * 0.5 = 50 > 10
N*(1-p0) = 100 * 0.5 = 50 > 10
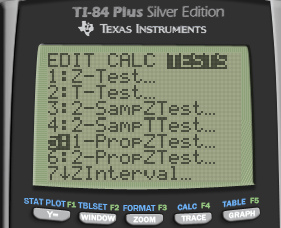
Calculate
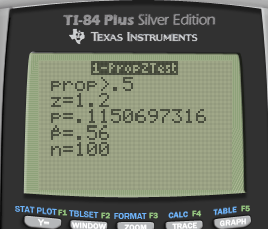
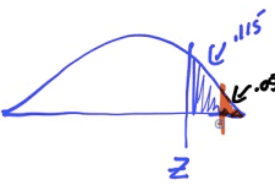
Look up the P-value
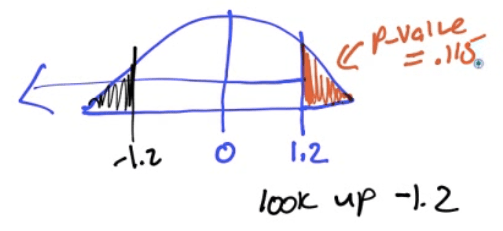
Interpret
Because p-value =0.1151 > α = 0.05, we fail to reject H0.
This means that we do not have evidence the claim that the true population proportion of college seniors with "good" prospect is above 0.5
Practice Question 3
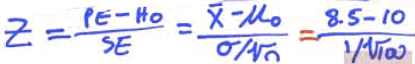
When the manufacturing process is working properly, the light bulbs have lifetimes that follow a right-skewed distribution with µ = 10 hours and SD = 1 hours.
A quality control statistician selects a simple random sample of n=100 light bulbs every hour and measures the lifetime of all light bulbs produced that hour is less than 10 hours at the 5% significance level, then all those light bulbs are discarded.
The current sample of 100 has a mean of 8.5, should this batch be discarded?
Write the hypothesis
H0: µ = 10
H1: µ < 10
Check conditions
Random: given, random sample
Independent: N > 10n = 1000
Normal: n = 100 > 30
Calculate
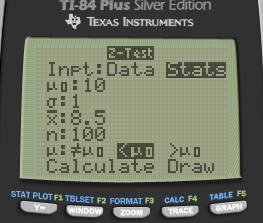
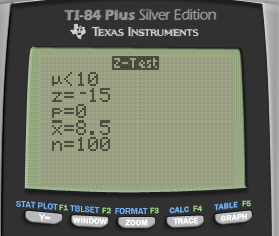
P-value
- P < 0.0002
Interpret
P < 0.0002 < α = 0.05
We reject the null hypothesis test.
We do have evidence to support the claim that the mean life of light bulbs is less than 10 hours, so we should discard this batch
Practice Question 4
The US Department of Transportation reported that 75% of all fatally injured automobile drivers were intoxicated. A random sample of 32 records in Carson County, Colorado, showed that 16 involved a drunk driver. Use a 99% confidence interval to determine whether or not there is evidence that indicates the population proportion of driver fatalities related to alcohol is different than 75%.
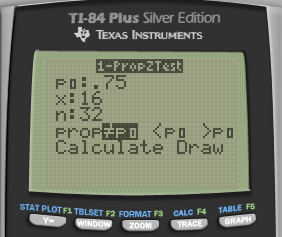
Write the hypothesis
H0: p = 0.75
H1: p ≠ 0.75
Conditions
Random: given
Independent: N > 10n = 320
Normal:
n*p = 32 * 0.75 = 24 > 10
n*(1-p) = 32 * 0.25 = 8 < 10
May not be normal, proceed with interpret with caution
Calculate
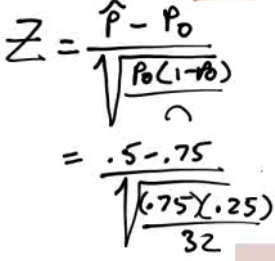
P-value
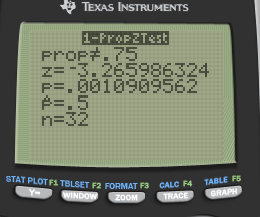
Interpret
- Because p = 0.001 < α, we reject H0 and do have evidence to support the claim that the population proportion of driver fatalities related to alcohol is different than 75%